Toma de decisiones de inversión en el espacio información-rentabilidad
Investment Decision-Making in the Information-Return Space
José Gabriel Astaíza-Gómez
Universidad EAFIT (Colombia)
https://orcid.org/0000-0001-5206-3976
RESUMEN
En este artículo, analizo el valor que los inversionistas asignan a analistas con menor volatilidad en sus errores de pronóstico. Desarrollo un modelo teórico que formaliza el papel de dicha volatilidad en las decisiones de inversión y propongo una estrategia basada en los pronósticos de los analistas, reconociendo el costo de evaluar la calidad de los informes. En un mercado con inversionistas heterogéneos, encuentro que los inversionistas informados, al aplicar una regla de filtrado según Anderson y Renault (1999), prefieren informes más consistentes. Estos resultados mejoran la comprensión sobre cómo los inversionistas manejan la incertidumbre de la información.
PALABRAS CLAVE
Pronóstico del analista; regla de búsqueda; valor fundamental; inversionista informado.
ABSTRACT
In this paper, I examine the value that investors place on analysts who exhibit lower forecast error volatility. Building on prior empirical research, I develop a theoretical model that formalizes the role of error volatility in investment decision-making. I propose an investment strategy that leverages analysts’ forecasts, acknowledging the challenges associated with distinguishing report quality, which can be costly in terms of time, money, and cognitive effort. The study focuses on a stock market with heterogeneous investors, where rational informed investors must screen reports of varying quality. I find that, when applying a screening rule à la Anderson and Renault (1999), informed investors incorporate both the news and the volatility of forecast errors, preferring more consistent reports for similar signals. These findings enhance understanding of how investors navigate information uncertainty and highlight the practical significance of the methodology for investment management.
KEYWORDS
Analyst forecast; searching rule; fundamental value; informed investor; investment management.
Clasificación JEL: G14, G23, D82.
MSC2010: 91B30, 91G10, 91B44.
Investors tend to value analysts who exhibit lower error volatility (Hilary and Hsu, 2013). Information search is costly (Grossman and Stiglitz, 1980), and evaluating the quality of forecasts in the information market is not straightforward. The challenges that financial professionals encounter when issuing recommendations are well-documented, including cognitive biases (Cai et al., 2022; Pouget et al., 2017), herding behavior (Jegadeesh and Kim, 2010; Trueman, 1994), and incentive structures (Charitou and Karamanou, 2020; Karmaziene, 2023) that often lead to overly optimistic forecasts (Easterwood and Nutt, 1999; De Bondt and Thaler, 1990).
In this paper, I first develop a theoretical model that formalizes previous findings from the empirical literature on the importance of forecast error volatility. Second, I propose an investment strategy that relies on analysts’ forecasts. Distinguishing the quality of reports can be costly in terms of time, money, and cognitive resources (Gabaix and Laibson, 2005) or even can be an impossible task for a subset of reports. I study the investment decision in a stock market with heterogeneous investors, when the rational informed investor must first screen analysts’ reports of varying quality. I find that the informed investor with a searching rule à la Anderson and Renault (1999), incorporates both the news about an asset as well as the consistency or volatility of forecast errors, and for two options with the same signal, he prefers the one with the most consistency.
This paper relates to a strand of literature that studies the informational value of analysts’ forecasts. I show that a rational framework provides a mechanism to explain why investors value analysts that exhibit lower error volatility even if these are biased. This is important in an era of robo-advisors since these tend to issue buy, hold, and sell recommendations with more balanced distributions than the recommendations of human analysts (Coleman et al., 2022). Variation in analyst recommendations affect stock returns specially for firms with higher uncertainty on their fundamental value (Kim et al., 2021). Importantly, the presence of uninformed investors in the stock market is a fertile soil for inflated forecasts since optimistic reports still reveal valuable information to informed investors while increasing the responsiveness of the uninformed (Kartik et al., 2007). Moreover, this paper adds to the literature on search costs in financial markets. Differences in error volatility and the need of a searching process on valuable information plausibly stops the market from concentrating all the demand for analyst reports, in those analysts with the lowest error or highest forecast accuracy. Similarly, Sirri and Tufano (1998) argue that investors in the equity funds market fail to flee from lower-performing funds due to search costs. González, Astaíza-Gómez, and Pantoja (2024) demonstrate that the opaque nature of individual stock performance in emerging markets presents unique investment opportunities for mutual funds. Additionally, Hortaçsu and Syverson (2004) find that the dispersion in fund fees and the existence of a large number of funds can be explained by search frictions. This literature is relevant because cognitive resources are limited and must be allocated properly, just like other scarce resources (Gabaix and Laibson, 2005).
As one can intuit, the quality of the reports is far from being standard (Liang et al., 2022). Where a public ranking of analysts exists, an investor can follow the best financial professional in the ranking but there is still a high degree of uncertainty about the accuracy of each report made by this analyst as the fundamental value of an asset is an unobservable variable (Fischer et al., 2022). The discrepancy among forecasts, as seen in the example in Table 1, introduces both a difficulty and an opportunity to profit from analysts’ reports. 1
Table 1. Intel Analyst Ratings Issued Between September 20 and October 5, 2023.
|
Analyst |
Firm |
Rating |
Price Target |
Upside |
Date |
|
Quinn Bolton |
Needham |
Strong Buy |
$40 |
+11.20 % |
Oct 5, 2023 |
|
Gus Richard |
Northland Capital Markets |
Buy |
$56 |
+55.69 % |
Oct 4, 2023 |
|
Suji Desilva |
Roth MKM |
Hold |
$35 |
–2.70 % |
Oct 4, 2023 |
|
Hans Mosesmann |
Rosenblatt |
Strong Sell |
$17 |
–52.74 % |
Oct 4, 2023 |
|
Suji Desilva |
Roth MKM |
Hold |
$35 |
–2.70 % |
Sep 22, 2023 |
|
Hans Mosesmann |
Rosenblatt |
Strong Sell |
$17 |
–52.74 % |
Sep 20, 2023 |
Source: https://stockanalysis.com
As of 2022, 3,766 investment professionals across 1,557 asset management firms voted in order to rank analysts and assess their individual talent for the 2022 All-America Research Team. For the two management firms at the top of the ranking it included 91 analysts 2. Furthermore, each analyst has a history of forecasts and forecast errors from which investors can grasp a sense of both his accuracy and error volatility.
Figure 1: Target Prices and Forecast Errors Issued by an Analyst at Tudor Pickering and Co. for Devon Energy Corp

More volatile forecast errors make it more difficult to properly form expectations from analysts’ forecasts and investors face a variety of reports, from the most optimistic to the most conservative. An analyst that half of the time issues reports with projections on target prices (earnings per share) that are dollars above the realized stock price (earnings per share), and half of the time issues projections dollars below realized prices (earnings per share), will exhibit an average forecast error of zero. But these reports are less informative than those issued by an analyst who consistently reports forecasts that are dollars above the realized values, as the investor can use these incorrect -but consistent- reports as predictable transformations of realized values (Hilary and Hsu, 2013). In spite of observed forecasts not being biased in a deterministic amount, an analyst that is making a prediction on a fundamental value Φ even if his forecast error εi = ηi - Φ has an expectation μi different than zero, is more valuable for an investor than another analyst, as long as the volatility σi2 of his errors is lower than that of. To the extreme, if σi2 was equal to zero, then the investor could systematically predict the fundamental value, even if the provided estimation was different to the fundamental value at any point of time.
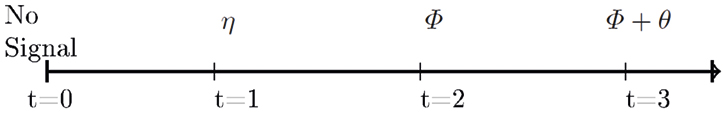
In a scenario where rational speculators counter the deviations of stock prices by trading against less rational investors, one would expect that issuing accurate forecasts should be a matter properly modelling the data generating process of the history of prices. Unfortunately, there are no informationally efficient markets (Grossman and Stiglitz, 1980) and the success of any forecast heavily depends on the realized prices in a market with heterogeneous investors (e.g. Múnera and Agudelo, 2022), including informed investors, uninformed investors and noise traders, or positive feedback traders as referred by De Long et al. (1990). In a simple case with four dates from 0 to 3 and a stock that pays a dividend at date 3, we can think of investors as trying to make profits on a stock that pays Φ∈{-ϕ,0,ϕ} plus a risky amount. Notice as shown in Figure 2, that the relevant decisions take place at dates 1 and 2. At periods 1 and 2 the market clearing conditions with heterogeneous agents are
(1)
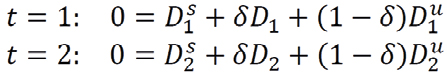
for a market with a measure of 1>δ>0 of informed investors, 1-δ of uninformed investors and positive feedback traders that exist in a measure of 1. An informed rational investor is characterized by the fact that he acquires information or receives an early signal ηi about Φ in order to take a decision on his investments (Grossman and Stiglitz, 1980; De Long et al., 1990) while the uninformed investor incorporates the value of Φ only when it is public at date 2. For the positive feedback trader, only past prices are relevant and his demand at date 2, DiS, is described by a function of past stock prices D2S =β(p1-p0)
Figure 2. Information Sequence
For a known distribution of θ and a known joint distribution of (η,Φ), the maximization of the mean-variance utility over the certainty equivalents provides the demand of the informed investor. Assume as in De Long et al. (1990), that  and that
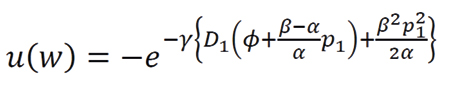
 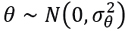 . Whenever the investor with a Bernoulli utility function u(x)=-e-γx receives a signal η=ϕ at period 1, the available certainty equivalents of period 2 are
(2)
4. The Value of Consistency
Analysts worldwide make their best efforts to provide valuable forecasts for investors (Stickel, 1992). In turn, investors pay the costs of searching, acquiring and processing the available forecasts which they incorporate in their decision making. Retail investors tend to incorporate the information of the more optimistic reports (Mikhail et al., 2007), institutional investors tend to take decisions by looking at several reports in order to unwind the higher weighting of good news in analysts’ forecasts (Hugon and Muslu, 2010) and forecast errors with a lower standard deviation have greater ability to move stock prices (Hilary and Hsu, 2013). The informed investor that incorporates the signal ηi provided by analyst i, takes his investment decision by maximizing the expectation of his utility function:
(3)
With ηi = Φ+ εi, εi~N(μi,σi2), the expected utility, i.e. the mean - variance utility function at period 1 is:
(4)
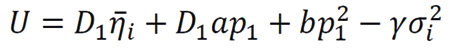
Where  ,
,  and
and  . The investor that incorporates an analyst report, when making his investment decision, is concerned about both, the estimated fundamental value he gets from analyst i and the accuracy or consistency of this analyst. The investor sticking to analyst i, would prefer this analyst to report higher fundamental estimates with lower inconsistency.
5. Screening Analysts
As analysts provide public forecasts, investors can choose to sample more than one analyst. In doing so, an investor ponders his incremental expected utility from searching an additional option (Anderson and Renault, 1999; Kohn and Shavell, 1974), or one more analyst. Assume the investor’s current best option is an analyst of consistency σ*2 who issues the signal ηi. If the investor samples another analyst at which he expects consistency σi2, he will prefer to incorporate his signal ηi if
(5)

For the same fundamental average estimations  , the investor prefers analyst i whenever i is more consistent (σ*2> σi2). With a cross-average forecast error
  distributed N(Φ,σ2) across analysts, the investor’s indifference point
  for any two alternatives, yields the expected incremental utility from searching one more analyst
(6)
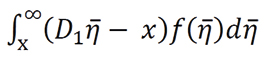
The greater the consistency expected from a new potential analyst (smaller σ*2), the smaller the value of x and, for any signal  >x, the greater the expected incremental utility from searching one more analyst. These results help explaining the empirical relation of forecast error volatility and stock prices, as presented in (Hilary and Hsu, 2013). Forecasts with consistent forecast errors are more informative in stock markets than accurate forecasts and consistent analysts face a lower probability of being demoted. This suggests that differences in error volatility and search costs allow the existence of systematically biased analysts in the market of information intermediaries as the absence of these two characteristics would yield an information market where the demand for equity research would all be channeled to the least biased analyst.
Notice that the results above are independent of the existence of noise traders, as the incremental expected utility of the informed investor always incorporates the signal and the consistency, for any feasible values of the parameters in the utility functions of the noise trader and the uninformed investor.
6. Portfolios of Analysts’ Reports
In the previous section, I demonstrated that a rational investor values both the accuracy and consistency of available reports, selecting the one that offers the highest expected utility. In practice, however, investors may rely on multiple reports for the same strategy, rather than limiting their choices to a single report.
The use of several reports implies that the investor assigns different weights to the forecast available, and the best target price is a weighted sum of analysts’ forecasts. If the investor wants to maximize the consistency, i.e. to minimize the error variance, an optimization problem à la Markowitz in which the covariances between the forecast errors inform the investor on the consistency of the reports in his set of available forecasts, provides a practical framework to incorporate target prices of different quality in the investment strategies. As it makes no sense to assign negative weights to analysts, the problem is a constrained optimization problem where the solution is constrained to the conditions that all weights are positive and add to one.
In many circumstances, investors count with the consensus forecasts for the available stocks. The covariances between errors of pairs of stocks help informing the investor on the common difficulty of providing quality forecasts (Astaíza-Gómez, 2025). An investor concerned with the expectation and variance of portfolio signed errors should hold a portfolio on the mean-variance efficient frontier, first characterized by Markowitz (Markowitz and Todd, 2000). Estimation error in the sample mean is much larger than in the sample covariance matrix when using historical returns and portfolios constructed using historical data on stock returns perform poorly out of sample (DeMiguel and Nogales, 2009). Asset allocation can be performed from a constrained minimization problem of the overall consistency of the forecast errors on the stocks available. As more consistent consensus forecasts are more valuable than less consistent forecasts, using analysts forecasts and error consistency, is a viable alternative to historical stock returns to construct the covariance matrix and projected returns.
For a practical application, consider the listed stocks included in the CRSP index that also have target prices provided by financial analysts. Figure 3 depicts the histogram of signed errors for 2,873 stocks. As expected, given analysts’ incentive structures, the right tail of the histogram is longer than the left, the average forecast error is positive, and the maximum error exceeds the absolute value of the minimum (see Table 2).
Figure 3. Histogram of Signed Errors for stocks in the U.S. market.
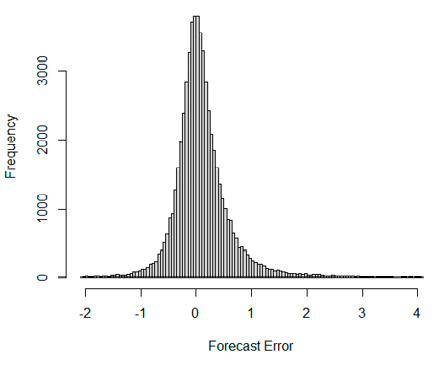
Table 2. Summary statistics on signed forecast errors
|
Minimum |
1st Quartile |
Median |
Mean |
3d Quartile |
Maximum |
|
–2.07728 |
–0.16282 |
0.04267 |
0.11734 |
0.30287 |
4.05181 |
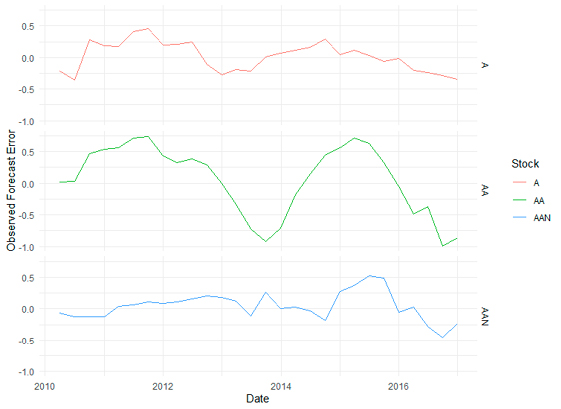
To this exercise, I calculate the error as the difference between the target price and the realized price, scaled by the price. Notice that scaling by the stock price provides this metric with a clear interpretation of the data. Specifically, the error can be interpreted as a projected return. Figure 4 presents an example of projected returns on three stocks over time. As the optimization problem requires estimating the variances and covariances of returns, I present the covariance matrix for 10 stocks in Table 3, where the diagonal elements represent the variances of each stock, and the off-diagonal elements represent the covariances between each pair of stocks. Each combination of stocks (i.e. a portfolio) counts with a projected return and error variance or consistency. It is straightforward to calculate different portfolios and locate these in the information-return space as shown in Figure 5.
|
A |
AA |
AAN |
AAON |
AAP |
AAWW |
AAXN |
ABC |
ABG |
ABM |
|
|
A |
0.053 |
|||||||||
|
AA |
0.085 |
0.296 |
||||||||
|
AAN |
0.012 |
0.056 |
0.049 |
|||||||
|
AAON |
0.039 |
0.046 |
–0.012 |
0.138 |
||||||
|
AAP |
–0.001 |
0.016 |
–0.008 |
0.019 |
0.078 |
|||||
|
AAWW |
0.030 |
0.071 |
0.025 |
–0.012 |
–0.012 |
0.097 |
||||
|
AAXN |
–0.022 |
–0.024 |
–0.012 |
0.075 |
0.043 |
–0.023 |
0.275 |
|||
|
ABC |
0.010 |
0.035 |
0.012 |
0.039 |
0.039 |
0.016 |
0.073 |
0.067 |
||
|
ABG |
–0.001 |
0.033 |
0.001 |
0.054 |
0.058 |
–0.004 |
0.127 |
0.066 |
0.103 |
|
|
ABM |
0.028 |
0.043 |
–0.007 |
0.043 |
0.003 |
0.024 |
0.017 |
0.007 |
0.006 |
0.036 |
Figure 5. Information-Return space
Most importantly, this framework enables the investor to construct an efficient frontier, from which resources can be allocated according to individual risk preferences. The problem to be solved is:
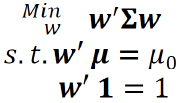
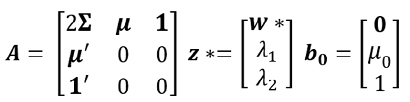
Where Σ is the covariance matrix and is a vector of weights. The Lagrange function is:
(7)

The solution is of the form z*=A-1 b0 where the efficient portfolio, w*, is given by:
(8)
Any linear combination of efficient portfolios is also an efficient portfolio, and its variance is a function of the covariance between portfolios. Consider the efficient portfolios y and w, and α∈ R Their combination:
(9)
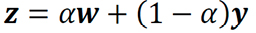
is also an efficient portfolio with variance:
(10)

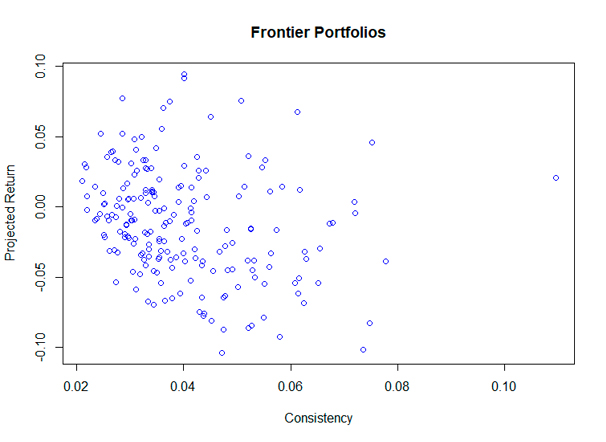
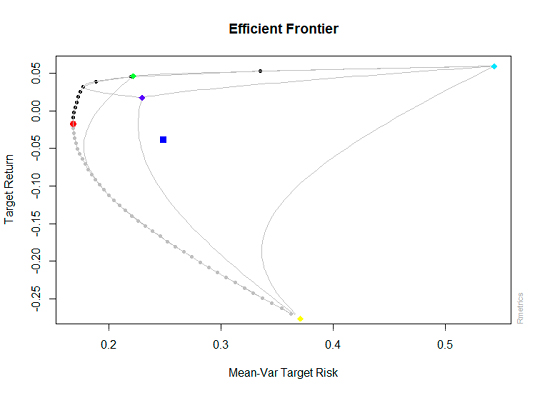
Where w’Σy is the covariance between the portfolios. Figure 6 below, shows a set of efficient portfolios constructed from analysts’ forecasts, which corresponds to the bullet-shaped line starting from the red point and followed by the bold black points.
Figure 6. Efficient frontier in the Information-Return space
7. Conclusions
The quality of reports in the market of information intermediaries is heterogenous. In this research I study the decision-making process of an investor with a search rule à la Anderson and Renault (1999) who must decide on which signal to incorporate when analysts issue forecasts of varying error volatility. In a market with investor heterogeneity à la De Long et al. (1990), the informed rational investor ponders the news about an asset contained in a report as well as the volatility of forecast error. Importantly, for two options with the same information on the fundamental value, he prefers the option with the most consistency. With investors of heterogeneous ability to establish the quality of analysts’ reports, uninformed investors allow analysts to issue inflated forecasts as optimistic reports reveal valuable information to informed investors (Kartik et al., 2007). To the opposite extreme, literature shows that some people are willing to stick to predictions that are blatantly useless (Powdthavee and Riyanto, 2015). The fact that some investors invest more in their search process, is also a plausible argument to explain the existence of systematically biased analysts in the market of financial advisors since in a market without search costs and no differences in error volatility, the least biased analyst would obtain all the attention.
Investors aim to maximize expected utility by considering both the accuracy and consistency of available reports. In practice, they often use multiple reports for a single strategy, assigning different weights to each forecast, making the optimal target price a weighted sum of these forecasts. To minimize error variance and enhance consistency, investors can use a Markowitz-style optimization framework, considering the covariances between forecast errors. This requires a constrained optimization where all weights are positive and sum to one. When relying on consensus forecasts, the covariances between errors of different stocks provide insight into the forecasting difficulty, allowing investors to minimize overall forecast error variance through a similar constrained optimization process.
REFERENCES
and (1999). Pricing, product diversity, and search costs: A bertrand-chamberlin-diamond model. The RAND Journal of Economics, 34(4): 719-735.
(2025). Forecast Quality with Information Uncertainty. Balancing and Estimation from Propensity Scores. Revista Colombiana de Estadística, 48(1): 157-175.
, and (2022). Equity Analyst Reports and Stock Prices. Apuntes del CENES, 41(73): 41-60.
, , and (2022). Confirmation bias in analysts’ response to consensus forecasts. Journal of Behavioral Finance, 25(3): 1-22.
and (2020). Sleeping with the enemy: should investment banks be allowed to engage in prop trading? Review of Accounting Studies, 25: 513-557.
, , and (2022). Human versus machine: A comparison of robo-analyst and traditional research analyst investment recommendations. The Accounting Review, 97(5): 221-244.
and (1990). Do security analysts overreact? The American economic review, 80(2): 52-57.
, , , and (1990). Positive feedback investment strategies and destabilizing rational speculation. The Journal of Finance, 45(2): 379-395.
, and (2009). Portfolio selection with robust estimation. Operations Research, 57(3): 560-577.
and (1999). Ineciency in analysts’ earnings forecasts: Systematic misreaction or systematic optimism? The Journal of Finance, 54(5): 1777-1797.
, , and (2022). Disagreement about fundamentals: Measurement and consequences. Review of Accounting Studies, 27(4): 1423-1456.
and (2005). Bounded rationality and directed cognition. Harvard University, 20.
, , and (2024). Actively managed equity mutual funds in emerging markets. Research in International Business and Finance, 72, 102540.
and (1980). On the impossibility of informationally efficient markets. The American Economic Review, 70(3): 393-408.
and (2013). Analyst forecast consistency. The Journal of Finance, 68(1): 271-297.
and (2004). Product dierentiation, search costs, and competition in the mutual fund industry: A case study of S&P 500 index funds. The Quarterly journal of economics, 119(2): 403-456.
and (2010). Market demand for conservative analysts. Journal of Accounting and Economics, 50(1): 42-57.
and (2010). Do analysts herd? an analysis of recommendations and market reactions. The Review of Financial Studies, 23(2): 901-937.
(2023). The greater the volume, the greater the analyst. Finance Research Letters, 51: 103377.
, , and (2007). Credulity, lies, and costly talk. Journal of Economic Theory, 134(1): 93-116.
, , and (2021). Information uncertainty, investor sentiment, and analyst reports. International Review of Financial Analysis, 77: 101835.
and (1974). The theory of search. Journal of Economic Theory, 9(2): 93-123.
, , , and (2022). The information content of analysts’ textual reports and stock returns: Evidence from China. Finance Research Letters, 46: 102817.
, and (2000). Mean-variance analysis in portfolio choice and capital markets (Vol. 66). John Wiley & Sons.
, , and (2007). When security analysts talk, who listens? The Accounting Review, 82(5): 1227-1253.
and (2022). Who moved my liquidity? liquidity evaporation in emerging markets in periods of financial uncertainty. Journal of International Money and Finance, 129: 102723.
, , and (2017). A mind is a terrible thing to change: confirmatory bias in financial markets. The Review of Financial Studies, 30(6): 2066-2109.
and (2015). Would you pay for transparently useless advice? a test of boundaries of beliefs in the folly of predictions. Review of Economics and Statistics, 97(2): 257-272.
and (1998). Costly search and mutual fund flows. The Journal of Finance, 53(5): 1589-1622.
(1992). Reputation and performance among security analysts. The Journal of Finance, 47(5): 1811-1836.
(1994). Analyst forecasts and herding behavior. The review of financial studies, 7(1): 97-124.