Información cualitativa: una propuesta de medición para cuantificar los efectos del COVID-19 sobre el bienestar emocional de mujeres y hombre mediante proximidades
Qualitative information: a proposal for measurement to quantify eh effects of COVID-19 on the emotional well-being of women and men by means of proximities
Raquel González-Pozo
Universidad Complutense de Madrid (Spain)
https://orcid.org/0000-0002-2827-9256
RESUMEN
El bienestar emocional es un factor fundamental que influye directamente en la productividad individual desde una perspectiva económica. Recientemente, la pandemia de la COVID-19 ha sido un factor significativo que ha afectado al bienestar emocional. Esta crisis ha tenido graves repercusiones en las economías y las sociedades, así como importantes efectos psicológicos y sociales en la población, tales como ansiedad, estrés y transformaciones en la educación y el empleo. Para medir estos aspectos, es muy habitual utilizar encuestas basadas en escalas cualitativas. El método más popular para manejar la información cualitativa consiste en asignar valores numéricos a las categorías de respuesta de estas escalas cualitativas. Sin embargo, esta práctica puede producir una interpretación distorsionada de los datos, ya que se pueden obtener resultados diferentes según cómo se asignen los valores numéricos. El objetivo de este trabajo es analizar el impacto del coronavirus en determinados aspectos emocionales de mujeres y hombres en España mediante un indicador basado en el concepto de medidas de proximidad ordinal. La base de datos utilizada en este estudio se obtuvo del Centro de Investigaciones Sociológicas de España.
PALABRAS CLAVE
Escalas cualitativas; COVID;19; Centro de Investigaciones Sociológicas; Medidas de proximidad ordinal.
ABSTRACT
Emotional well-being is a fundamental factor that directly influences individual productivity from an economic perspective. Recently, the COVID-19 pandemic has been a significant factor that has affected emotional well-being. It has had serious repercussions on economies and societies, as well as significant psychological and social effects on the population, such as anxiety, stress, and transformations in education and employment. To measure these aspects, it is very common to use surveys based on qualitative scales. The most popular method for managing qualitative information involves assigning numerical values to the response categories of these qualitative scales. However, this practice can produce a distorted interpretation of the data, as different results can be obtained depending on how the numerical values are assigned. The aim of this paper is to analyze the impact of the coronavirus on certain emotional aspects of women and men in Spain using an indicator based on the concept of ordinal proximity measures. The database used in this study was obtained from the Sociological Research Center of Spain.
KEYWORDS
Qualitative scales; COVID;19; Sociological Research Center of Spain; Ordinal proximity measures.
Clasificación JEL: C20; C83.
MSC2010: 62C12; 62C86
1. INTRODUCTION
Qualitative information plays a fundamental role in the analysis of economic and social factors. It is used for assessing aspects such as quality of life, satisfaction with public services and the impact of social policies. In addition, this type of information is essential for evaluating our physical and mental health, since it provides a complete understanding of how people experience and manage their well-being, emotions and social relationships (Khaneja et al., 2022, Potss, et al., 2023, Wang et al., 2020).
The emotional well-being of the people is a very important factor that directly influences individual productivity from an economic perspective. When people have a good state of mental health, they tend to be more productive, creative and can contribute more effectively to the economy. However, with the coronavirus pandemic, it has been shown that the deterioration of emotional well-being has affected the personal and professional lives of individuals, and consequently, the economy as a whole (Anglim and Horwood, 2021; Godinić and Obrenovic, 2020; Russo et al., 2021). This crisis has not only changed habits and the way we relate to each other, but has also exacerbated gender, social, and economic inequalities, affecting our family situations and our mental health (Aguilar-Palacio et al., 2018; Dahl, 1993; Virtanen et al., 2003). Although gender inequalities have not been definitively proved to be the reason why women are more likely than men to suffer from anxiety and depression, these disparities are still considered contributing factors. Women are often more affected by domestic violence, have fewer opportunities for social integration, experience home confinement, and face social expectations related to their reproductive roles, all of which can have significant implications for their mental health (Fisher and Ryan, 2021; Mittal and Singh, 2020).
Since the beginning of the pandemic, numerous organizations and statistical agencies have been working to analyze the effects and consequences of the virus. To achieve these objectives, they have designed and conducted several surveys focused on collecting data on how the COVID-19 pandemic has affected individuals’ lives. To measure mental, physical, and spiritual well-being (Bech et al., 2003; Genia, 2001; Machut et al., 2022; Stewart-Brown et al., 2009, Vella-Brodrick and Allen, 1995), surveys and questionnaires often employ ordered qualitative scales composed of labels or linguistic terms, such as Likert-type scales (Likert, 1932). These scales are the most popular tools for measuring attitudes, knowledge, opinions and other qualitative aspects. They are frequently used in the fields of Economics, Psychology and Sociology to assess and determine the level of well-being of a population (Bambra et al., 2020; Ferragut and Fierro, 2012; Pontin et al., 2013).
A characteristic of these scales is that they use the same ordered qualitative scale to evaluate all the items or statements, which are usually assigned the same weight or importance within the questionnaire. Although in Likert-type scales, elements can be analyzed individually, it is very common to calculate the sum or the average of the responses. To carry out these arithmetic operations with items, numerical encodings are required, which are arbitrary in most cases.
Assigning numerical values or scores to the labels or linguistic terms of the scales is the most popular method for managing qualitative information (Fielding, 1993; Roberts, 1979). Nevertheless, the main criticism of this method is the subjectivity introduced when numerical values are used to represent qualitative information (Calatrava Requena, 1977). This is because using numerical values can imply that there is some sort of proportional relationship between the response categories. However, this relationship is not necessarily present, as in ordered qualitative scales the differences between numerical values do not measure any meaningful magnitude (see Agresti, 2010; Knapp, 1990; Stevens, 1946, 1951).
Therefore, the treatment of qualitative information requires a careful statistical and mathematical analysis, since there are no universally established criteria about the techniques or procedures to be applied. The literature presents several procedures and methods for managing qualitative data. These include models based on fuzzy numbers and membership functions (Herrera et al., 2008), linguistic representation models such as the 2-tuple model introduced by Herrera and Martinez (2000), cumulative models (McCullagh, 1980; Tutz, 2012) and CUB (Combination of Uniform and Binomial) models introduced by Piccolo (2003).
In addition, another procedure for handling qualitative data is the creation of indicators. According to Mondragón Pérez (2002), although there is no official definition from any national or international organization, indicators are “tools to clarify and define, more precisely, objectives and impacts”. They can be either qualitative or quantitative, though the latter are more common. When ordered qualitative scales are used to design indicators, analysts and researchers often assign numerical scores to the response categories of the scales. For example, to create the Consumer Confidence Index, the Sociological Research Center of Spain (CIS in Spanish) assumes equidistance between the response categories and assigns the scores {0, 25, 50, 75, 100} to the scale {“Very bad”, “Bad”, “So-so”, “Good”, “Very good”} 1. However, these considerations can distort the results obtained from ordered qualitative scales, as different outcomes can arise depending on how the response categories are coded (Bashkansky and Gadrich, 2008; Franceschini et al., 2004; Gadrich, 2015; Molina Martínez and González del Pozo, 2024).
On the other hand, another factor that can influence the analysis of qualitative data is how individuals perceive qualitative scales. Sometimes, common sense, the semantic value of words, cultural differences, or even an individual’s personality can cause qualitative scales to be perceived as non-uniform. In this sense, an ordered qualitative scale can be considered non-uniform if individuals perceive different psychological proximities between the consecutive linguistic terms of the scale (García-Lapresta and Pérez-Román, 2015). For example, the ordered qualitative scale used to construct the Consumer Confidence Index could be considered as non-uniform if individuals perceive the term “Bad” to be psychologically closer to “So-so” than to “Very bad,” or if the term “Good” is perceived to be psychologically closer to “Very good” than to “So-so”. Thus, the different ways of perceiving the proximities of the scales may affect how individuals interpret and respond to the scale, which could lead to inconsistencies in the data (González del Pozo and García-Lapresta, 2019).
Given the significant impact of emotional well-being on the productivity of employees and considering that the COVID-19 crisis has been one of the most severe challenges in recent years, this paper aims to analyze the impact of the pandemic on the emotional well-being of men and women in Spain. Using a dataset from the Sociological Research Center of Spain, the paper introduces an emotional well-being indicator based on the concept of ordinal proximity measure introduced by García-Lapresta and Pérez-Román (2015). This concept considers the psychological proximities between the linguistic terms of the ordered qualitative scales and has been implemented to develop new decision-making procedures that address non-uniform qualitative scales (Franceschini and García-Lapresta, 2019; García-Lapresta and Pérez-Román, 2018; González del Pozo and García-Lapresta, 2021). Additionally, it has been applied in various sociological and political contexts (González del Pozo and García-Lapresta, 2019).
The rest of this paper is organized as follows. Section 2 recalls the concept of ordinal proximity measure and presents the methodology used to create indicators from qualitative information. Section 3 shows an application in which the effects of the COVID-19 are measured by indicators based on ordinal proximity measures. Section 4 presents a brief discussion of the results obtained. Finally, Section 5 provides some concluding remarks and suggestions for future research.
2. METHODOLOGY
The use of indicators is quite common for evaluating qualitative data within the framework of Social Sciences, such as Sociology, Political Science, and Economics. These indicators try to synthesize information related to a certain set of variables by means of the use of numerical values allocated to the response categories of the scales. For example, the Sociological Research Center of Spain allocates equidistant scores to create some economic indicators such as: the Economic Trust, the Current Economic Situation and the Economic Forecast.
To avoid using arbitrary numerical values and to consider the non-uniformity of scales, this section presents a proposal for creating indicators using qualitative information from different qualitative scales. These indicators are based on the concept of ordinal proximity measure introduced by García-Lapresta and Pérez-Román (2015), which collects information about how individuals perceive the proximities between the linguistic terms of an ordered qualitative scale. An advantage of ordinal proximity measures is that they respect the ordinal information of the scale as much as possible and can be applied in the context of non-uniform qualitative scales.
2.1. Ordinal proximity measures
To define ordinal proximity measures, we need to consider an ordered qualitative scale L={l1 , … ,lg } whose terms are arranged from worst to best: l1 ≺⋯≺ lg , with g≥3 .
This concept is based on a set of degrees of proximity ∆={δ1 ,…,δh} , with δ1 ≻⋯≻ δh , where δ1 and δh represent the maximum and minimum degrees of proximity, respectively. It is important to highlight that the elements of ∆ are not numbers, they are abstract objects that represent different degrees of proximity.
Definition 1. An ordinal proximity measure on L with values in ∆ is a mapping π: L × L → ∆, where π(lr ,ls) = πrs represents the degree of proximity between lr and ls satisfying the following conditions:
1.Exhaustiveness: For every δ ∈ ∆, there exists lr ,ls ∈ L such that δ = πrs .
2.Symmetry: πsr = πrs , for all r, s ∈ {1, …, g}.
3.Maximum proximity: πrs = δ1 ⇔ r = s, for all r, s ∈ {1, …, g}.
4.Monotonicity: πrs ≻ πrt and πst ≻ πrt , for all r, s, t ∈ {1, …, g} such that r<s<t.
Every ordinal proximity measure can be represented by a g x g symmetric matrix with coefficients in ∆, where the elements of the main diagonal are πrr = δ1, r = 1, …, g:
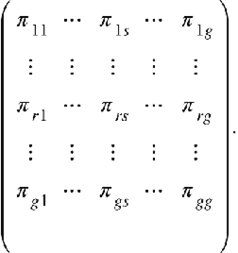
The above matrix is called proximity matrix associated with π.
To identify the matrices associated with ordinal proximity measures, the subscripts of the matrices (A’s) correspond to the subscript of the δ’s which appear in the coefficients just over the main diagonal, and they correspond to the comparisons between all the pairs of consecutive linguistic terms.
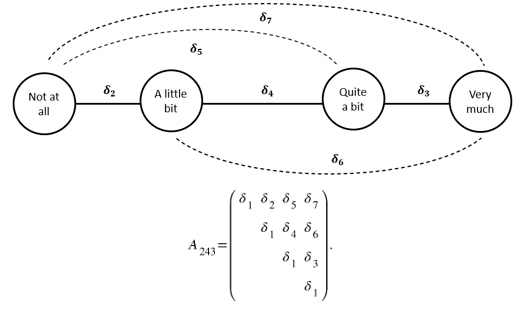
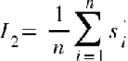
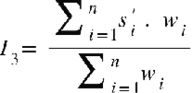
To illustrate how to construct and represent ordinal proximity measures in their corresponding matrices, Figure 1 illustrates an example of an ordered qualitative scale formed by four linguistic terms: {“Not at all”, “A little bit”, “Quite a bit”, “Very much”}. Specifically, the ordinal proximity measures considered are those associated with the proximity matrices A432 and A243 (see Figure 1a and Figure 1b, respectively).
Figure 1. Ordinal proximity measures associated with the proximity matrices A432 and A243.
Figure 1a. A432.
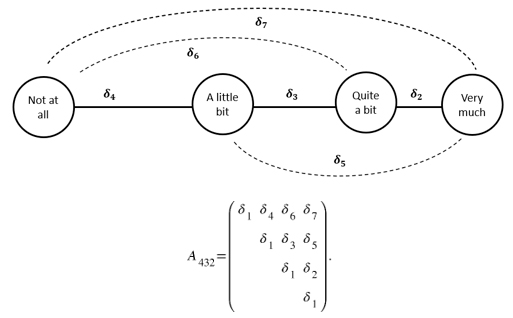
Figure 1b. A243.
Likewise, to establish an ordinal proximity measure, it is necessary for individuals to express their opinions about the proximities between the linguistic terms of the scale. To collect this information, the first step involves comparing the proximities between consecutive terms of the scale. For the case of three linguistic terms g = 3, these comparisons allow us to determine the three possible ordinal proximity measures. However, when g > 3, the complexity of obtaining ordinal proximity measures increases. In these situations, it is advisable to apply an algorithm that generates the ordinal proximity measure for each individual through an appropriate sequence of questions about the proximities between the linguistic terms of the scale (García-Lapresta et al., 2018). The algorithm starts by asking individuals about the ordinal proximities between consecutive terms of the scale. Subsequent questions differ depending on whether one of these proximities is greater than the other or if they are the same. The procedure continues with similar questions comparing the proximities between the remaining pairs of terms of the scale until the ordinal proximity measure is determined. However, when applying the algorithm, it is possible to obtain different ordinal proximity measures depending on how individuals perceive the qualitative scale. For this reason, García-Lapresta et al. (2018) proposed a procedure based on minimizing distances to determine the collective ordinal proximity measure that aggregates and represents individual opinions as faithfully as possible.
On the other hand, to determine ordinal proximity measures on an ordered qualitative scale, it is essential to mention the importance of context and question formulation. Individuals’ perceptions between the response categories can vary significantly depending on whether the question pertains to medical, political, or sociocultural issues.
2.2. Qualitative indicators based on ordinal proximity measures
To create indicators based on the concept of ordinal proximity measure, it is necessary to know the proximities between the terms of an ordered qualitative scale. To do that, the algorithm mentioned in the previous section can be applied (García-Lapresta et al., 2018).
Next, to determine a numerical value or score for each linguistic term, this paper proposes using the formula contained in Equation [1], which is based on the approaches introduced by Franceschini and García-Lapresta (2019) and García-Lapresta and González del Pozo (2023):

Equation [1] follows the approach of the Technique for Order Preference by Similarity to Ideal Solution (TOPSIS). In this method, introduced by Hwang and Yoon (1981), the chosen solution should have the shortest distance from the positive ideal solution (PIS) and the longest distance from the negative ideal solution (NIS). Therefore, in Equation [1], the element π(li ,l1) measures the proximity between the linguistic term (li) and the lowest response category on the scale (l1). In contrast, the element π(li ,lg) considers the proximity between the linguistic term (li) and the highest response category (lg). Thus, ρ (π(li ,l1)) − ρ (π(li ,lg)) considers the subscripts of the δ’s from π(li ,l1) and π(li ,lg). In a way that, if that difference is positive, the linguistic term (li) is closer to the highest response category than to the lowest one. In addition, Equation [1] introduces the element (h) to ensure positive scores. This element is derived from the subscript of the maximum degree of proximity (δh).
Since the procedure can be applied to several ordered qualitative scales, which may have a different number of response categories, it is advisable to carry out a linear normalization transformation process. The objective of this process is to obtain homogeneous scores for the response categories across the different ordered qualitative scales. An example of this process is as follows:
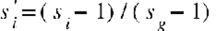
where s’i ∈ [0, 1].
Finally, using the normalized scores obtained from Equation [2], an indicator is created based on the objectives of the research study. Some of these indicators can be defined in various ways:
(3.1)

(3.3)
3. EMOTIONAL INDICATORS FOR MEASURING WELL-BEING: AN APPLICATION WITH REAL DATA
There is a considerable literature about how to measure well-being, quality of life, and well-being in general (Bech et al., 2003; Hills and Argyle, 2002; Nieboer et al., 2005). Moreover, since the COVID-19 pandemic, many studies have focused on identifying and assessing the impact of coronavirus on emotional well-being (Cowie and Myers, 2021; Saladino et al., 2020; Samlani et al., 2020). In this context, emotional well-being refers specifically to the dimension of well-being related to individuals’ emotions and affective states, such as anxiety, happiness, and satisfaction, which have been affected by the global health crisis (Lades et al., 2020; Khaneja et al., 2022, Potss, et al., 2023). Following these approaches, this section is devoted to measuring the emotional well-being of women and men in Spain using a set of data collected from the study Effects and consequences of Coronavirus (I) conducted by Sociological Research Center of Spain (2020). This allows us to assess how the pandemic has influenced the emotional dimensions of individuals’ well-being.
This study was carried out in October 2020 to study the effects and consequences of the coronavirus. A total of 2,551 people, 1,247 men and 1,304 women, participated in the survey.
Shaloch and Verdugo (2003) identify multiple dimensions for determining quality of life, including physical well-being, personal development, social inclusion, and emotional well-being, among others. Within the dimension of emotional well-being, key variables include happiness, personal satisfaction, self-evaluation, and the absence of stress. These variables are also utilized by other researchers to measure and analyze various indicators related to well-being (Gurin et al., 1960; Maggino, 2016; Serra and Mora, 2019; Villatoro, 2012).
To create the emotional well-being indicator, ten items or statements were selected from the questionnaire used by the Sociological Research Center of Spain. The items are shown in Table I of the Annex and were chosen considering emotional aspects such as happiness, optimism and vitality, which have already been considered in previous literature (Saladino et al., 2020; Samlani et al., 2020; Shaloch and Verdugo, 2003). To assess the statements contained in Table I of the Annex, two different ordered qualitative scales were employed in the questionnaire. The first five statements were measured using an ordered qualitative scale formed by five labels or linguistic terms, while the remaining statements were evaluated using an ordered qualitative scale with four linguistic terms (see Tables 1 and 2, respectively).
Table 1. Response categories for question 14. CIS3298.
|
l1 |
Strongly disagree. |
|
l2 |
Somewhat disagree. |
|
l3 |
Neither agree nor disagree. |
|
l4 |
Somewhat agree. |
|
l5 |
Strongly agree. |
Source: Own elaboration from the study Effects and consequences of Coronavirus (I). Question 14.
Table 2. Response categories for question 16. CIS3298.
|
l1 |
Almost never or never. |
|
l2 |
Occasionally. |
|
l3 |
Almost every time. |
|
l4 |
Every time. |
Source: Own elaboration from the study Effects and consequences of Coronavirus (I). Question 16.
Given that both scales are qualitative, it is possible to apply the proposed procedure by setting an appropriate ordinal proximity measure for each ordered qualitative scale, depending on how the proximities between the terms of each scale are considered. When the participants fill in the survey, they know the number of terms of linguistic terms of the scale. However, the Sociological Research Center of Spain, like many other national and international organizations, does not gather information on how individuals perceive qualitative scales. Therefore, in this application, the determination of the ordinal proximity measures was carried out by considering those that were the most logical and consistent with the meaning of the linguistic terms. For example, for the qualitative scale represented in Table 1, which is relatively symmetrical, the ordinal measures of proximity considered were A2332 and A4224. In the case of the scale represented in Table 2, which is made up of 4 items, the ordinal proximity measures used were A432 and A322. These ordinal proximity measures are represented in Figures 2 and 3, respectively.
Once the ordinal proximity measures have been established, we apply the formula in Equation [1] to determine the scores for each response category. These results are shown in Tables 3 and 4. Likewise, the normalized scores obtained after applying the linear normalization transformation process presented in Equation [2] are also shown in these tables.
Finally, to measure emotional well-being from the study data, we construct the additive indicators. Depending on the objectives of the research study, these indicators can be calculated, for example, as a mean or a sum of normalized scores (Bielderman et al., 2013, Calderón et al., 2018). In this application, the indicators were calculated using Equation [3.2] through the statistical software SPSS (v. 22). The results obtained are presented in Table 5.
Figure 2. Ordinal proximity measures associated with the proximity matrices A2332 and A4224. Question 14. CIS3298.
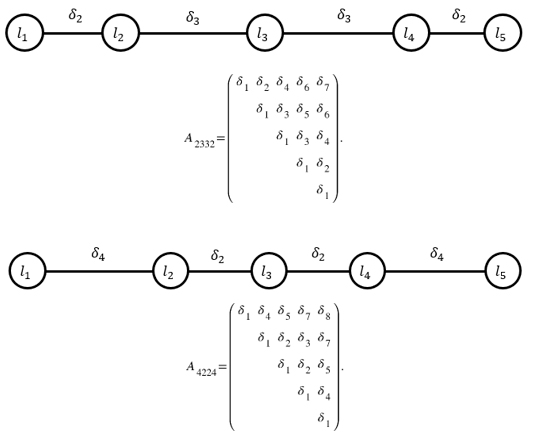
Figure 3. Ordinal proximity measures associated with the proximity matrices A432 and A322. Question 16. CIS3298.
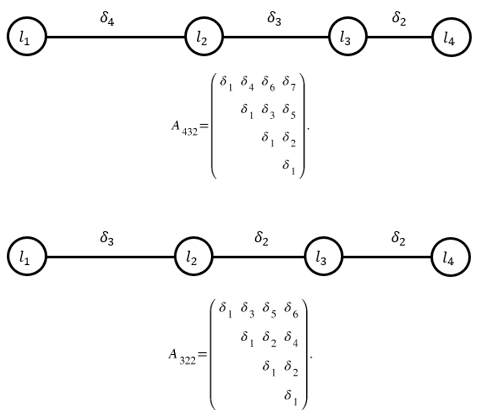
Table 3. Scores and normalized scores corresponding to the ordered qualitative scale of the question 14.
|
A2332 |
A4224 |
|||
|
si |
s’i |
si |
s’i |
|
|
l1 |
1 |
0 |
1 |
0 |
|
l2 |
3 |
1/6 |
5 |
2/7 |
|
l3 |
7 |
1/2 |
8 |
1/2 |
|
l4 |
11 |
5/6 |
11 |
5/7 |
|
l5 |
13 |
1 |
15 |
1 |
Source: Own elaboration.
Table 4. Scores and normalized scores corresponding to the ordered qualitative scale of the question 16.
|
A432 |
A322 |
|||
|
si |
s’i |
si |
s’i |
|
|
l1 |
1 |
0 |
1 |
0 |
|
l2 |
6 |
1/2 |
5 |
1/2 |
|
l3 |
9 |
4/5 |
7 |
3/4 |
|
l4 |
11 |
1 |
9 |
1 |
Source: Own elaboration.
Table 5 shows the emotional well-being indicators constructed based on the OPMS A2332 and A432, and A4224 and A322. In the case of men, the first indicator has a value of 0.7263 for males and 0.6712 for females, while these values take a value of 0.8521 for males and 0.7317 for females in the case of the second indicator. In addition, to analyze the differences by gender, a statistical analysis was performed using a t-test, which showed significant differences between men and women for both indicators.
Table 5. Emotional well-being indicator by gender.
|
N |
Indicator |
SD |
t-test |
p-value |
|
|
A2332 and A432 |
|||||
|
Male |
1,247 |
0.7263 |
0.1728 |
7.512 |
< 0.001 |
|
Female |
1,304 |
0.6712 |
0.1973 |
||
|
A4224 and A322 |
|||||
|
Male |
1,247 |
0.8521 |
0.1903 |
8.349 |
< 0.001 |
|
Female |
1,304 |
0.7317 |
0.1726 |
Source: Own elaboration.
4. DISCUSSION
The study presents a novel approach for measuring the emotional well-being of men and women during the COVID-19 pandemic by using ordinal proximity measures. This methodology takes into account the non-uniformity of ordered qualitative scales. The results show statistically significant gender differences in emotional well-being, with men generally presenting higher scores than women on both indicators. This suggests that the pandemic has had a different impact on emotional well-being depending on gender.
As discussed in Section 3, the items used to construct our indicators consider factors such as happiness, personal satisfaction, and optimism. The results reveal that men have a higher level of emotional well-being than women on both indicators. Although a direct comparison of the indicators with other procedures is not possible, our results are consistent with those reported by several studies on emotional well-being during the COVID-19 pandemic. For example, Ausín et al. (2021) determined by a linear mixed model that women had lower levels of emotional well-being, and more symptoms of depression compared to men. Lepinteur (2022) also identified a gender gap during the pandemic using an ordinary least squares regression analysis, finding a female penalty in emotional well-being, particularly regarding loneliness. Furthermore, Li et al. (2020) pointed out through multiple logistic regression models that women experienced higher levels of anxiety in comparison to men during the COVID-19 crisis.
Finally, it is important to highlight that the study of emotional well-being is essential from an economic perspective. During the pandemic, the levels of stress and anxiety caused by the health crisis affected workers’ productivity, in particular for those workers who faced job uncertainty, the challenges of remote work or job loss. This impact was especially significant for women, as noted by authors such as Li et al. (2020), Escudero-Castillo et al. (2021), and Russo et al. (2021), among others.
5. CONCLUDING REMARKS
This paper contributes to the literature about the effects of the COVID-19 pandemic on emotional well-being by introducing a methodology that addresses the limitations of traditional qualitative analysis. The application of ordinal proximity measures enables a more refined assessment of emotional well-being, highlighting the importance of considering psychological proximities between the terms of ordered qualitative scales. However, an important limitation is that the Sociological Research Center of Spain, and the vast majority of national and international survey agencies do not provide information about individuals’ perceptions of the scales. Therefore, our indicators have been constructed using the four ordinal proximity measures we have considered most logical, based on the meanings of their linguistic terms of the scales.
Therefore, for future research, it would be interesting to conduct a survey that specifically addresses individuals’ perceptions of ordered qualitative scales used. This would enhance the understanding of how emotional well-being indicators are interpreted and allow for the refinement and modification of the methodology based on ordinal proximity measures. Likewise, although this paper focuses on applying this concept to the Spanish Sociological Research Center data, it would be worth including a comparative analysis in future research. This could involve contrasting the results obtained from the Spanish data with those from other countries and different time periods, both before and after COVID-19.
Declaration of Conflicting Interests
The author declared no potential conflicts of interest with respect to the research, authorship, and/or publication of this article.
Acknowledgements
The author is grateful to two anonymous reviewers for their useful comments and suggestions. The financial support of the research project PID2021-122506NB-I00 funded by MICIU/AEI /10.13039/501100011033 and ERDF, EU, is acknowledged.
ANNEX
Table I. Statements used to create the emotional well-being indicator.
|
I am optimistic about my future. |
|
I am optimistic about the future of my children or grandchildren and other young family members. |
|
Generally, I think that what I do in life is beneficial and useful to others. |
|
In general, I feel active and vigorous. |
|
Generally, I am happy with myself. |
|
I was happy. |
|
I have felt calm and relaxed. |
|
I have had the feeling of enjoying life. |
|
I have felt full of energy and vitality. |
|
I have felt really rested when I got up in the morning. |
Source: Own elaboration from the study Effects and consequences of Coronavirus (I). Questions 14 and 16.
REFERENCES
(2010). Analysis of ordinal categorical data. Second edition. John Wiley & Sons.
, , , , & (2018). Recession, employment and self-rated health: a study on the gender gap. Public Health, 154, 44-50.
, & (2021). Effect of the COVID-19 pandemic and big five personality on subjective and psychological well-being. Social Psychological and Personality Science, 12(8), 1527-1537.
, , , & (2021). Gender-related differences in the psychological impact of confinement as a consequence of COVID-19 in Spain. Journal of Gender Studies, 30(1), 29-38.
, , , & (2020). The COVID-19 pandemic and health inequalities. Journal of Epidemiology & Community Health, 74(11), 964-968.
, & (2008). Evaluating quality measured on a ternary ordinal scale. Quality and Reliability Engineering International, 24(8), 957-971.
, , , & (2003). Measuring well-being rather than the absence of distress symptoms: a comparison of the SF-36 Mental Health subscale and the WHO-Five well-being scale. International Journal of Methods in Psychiatric Research, 12(2), 85-91.
, , , , , , & (2013). Multidimensional structure of the Groningen Frailty Indicator in community-dwelling older people. BMC geriatrics, 13(1), 1-9.
, & (2024). The female happiness paradox. Journal of Population Economics, 37(1), 16.
(1977). El método de “Ridit Analysis” para comparación múltiple de frecuencias muestrales ordenadas en niveles cualitativos: Aplicación al análisis de test y encuestas en sociología. Revista Española de la Opinión Pública, (47), 123-135.
, , , , , , & (2018). Psychometric properties of the Shared Decision-Making Questionnaire (SDM-Q-9) in Oncology practice. International Journal of Clinical and Health Psychology, 18(2), 143-151.
, & (2021). The impact of the COVID-19 pandemic on the mental health and well-being of children and young people. Children & Society, 35(1), 62-74.
(1993). Social inequality in health the role of the healthy worker effect. Social Science & Medicine, 36(8), 1077-1086.
, , & (2021). Furloughs, teleworking and other work situations during the COVID-19 lockdown: Impact on mental well-being. International Journal of Environmental Research and Public Health, 18(6), 2898.
, & (2012). Inteligencia emocional, bienestar personal y rendimiento académico en preadolescentes. Revista Latinoamericana de Psicología, 44(3), 95-104.
(1993). Scoring functions for ordered classifications in statistical analysis. Quality and Quantity, 27(1), 1-17.
, & (2021). Gender inequalities during COVID-19. Group Processes & Intergroup Relations, 24(2), 237-245.
, , & (2004). Qualitative ordinal scales: the concept of ordinal range. Quality Engineering, 16(4), 514-524.
, & (2019). Decision-making in semi-democratic contexts. Information Fusion, 52, 281-289.
(2015). Assessing variation: a unifying approach for all scales of measurement. Quality & Quantity, 49(3), 1145-1167.
, & (2023). Using scoring functions in a group decision-making procedure with heterogeneous experts and qualitative assessments. International Journal of Approximate Reasoning, 161, 109004.
, , & (2018). Metrizable ordinal proximity measures and their aggregation. Information Sciences, 448, 149-163.
, & (2015). Ordinal proximity measures in the context of unbalanced qualitative scales and some applications to consensus and clustering. Applied Soft Computing, 35, 864-872.
& (2018). Aggregating opinions in non-uniform ordered qualitative scales, Applied Soft Computing, 67, 652-657.
(2001). Evaluation of the spiritual well-being scale in a sample of college students. The International Journal for the Psychology of Religion, 11(1), 25-33.
, & (2020). Effects of economic uncertainty on mental health in the COVID-19 pandemic context: social identity disturbance, job uncertainty and psychological well-being model. International Journal of Innovation and Economic Development 6(1), 61-74.
, & (2019). Tratamiento ordinal de las escalas cualitativas utilizadas por el Centro de Investigaciones Sociológicas. Revista de Métodos Cuantitativos para la Economía y la Empresa, 28, 124-142.
, & (2021). Managing the smiley face scale used by Booking.com in an ordinal way. Journal of Theoretical and Applied Electronic Commerce Research 16 (2), 128-139.
, , & (1960). Americans view their mental health. New York: Basic Books.
, , & (2008). A fuzzy linguistic methodology to deal with unbalanced linguistic term sets. IEEE Transactions on Fuzzy Systems, 16(2), 354-370.
, & (2000). A 2-tuple fuzzy linguistic representation model for computing with words. IEEE Transactions on Fuzzy Systems, 8(6), 746-752.
, & (2002). The Oxford Happiness Questionnaire: a compact scale for the measurement of psychological well-being. Personality and Individual Differences, 33(7), 1073-1082.
, & (1981). Basic concepts and foundations. In Multiple Attribute Decision Making (pp. 16-57). Springer, Berlin, Heidelberg.
, , , & (2022). The effects of physical environment design on the dimensions of emotional well-being: a qualitative study from the perspective of design and retail managers. Qualitative Market Research: An International Journal, 25(2), 161-180.
(1990). Treating ordinal scales as interval scales: an attempt to resolve the controversy. Nursing Research, 39(2), 121-123.
, , , & (2020). Daily emotional well-being during the COVID-19 pandemic. British Journal of Health Psychology, 25(4), 902-911.
, , , , , & (2022). Gender, loneliness and happiness during COVID-19. Journal of Behavioral and Experimental Economics, 101, 101952.
, , , , , & (2020). Prevalence and factors for anxiety during the coronavirus disease 2019 (COVID-19) epidemic among the teachers in China. Journal of Affective Disorders, 277, 153-158.
(1932). A technique for the measurement of attitudes. Archives of Psychology, 22, 1-55.
, , , , , , & (2022). Effect of Coronavirus Disease-2019 on the Workload of Neonatologists. The Journal of Pediatrics, 242, 145-151.
(2016). Challenges, needs and risks in defining well-being indicators. In: A Life Devoted to Quality of Life (pp. 209-233). Springer.
(1980). Regression models for ordinal data (with Discussion). Journal of the Royal Statistical Society B, 42(2), 109-127.
, & (2020). Gender-based violence during COVID-19 pandemic: a mini-review. Frontiers in Global Women’s Health, 1(4).
, & (2024). Real estate crowdfunding in Spain. Revista Universitaria Europea, 40, 73-102.
(2002). ¿Qué son los indicadores? Revista de Información y Análisis, 19, 52-58.
, , , & (2005). Dimensions of well-being and their measurement: the SPF-IL scale. Social Indicators Research, 73(3), 313-353.
(2003). On the moments of a mixture of uniform and shifted binomial random variables. Quaderni di Statistica, 5, 85-104.
, , , & (2013). A UK validation of a general measure of subjective well-being: the modified BBC subjective well-being scale (BBC-SWB). Health and Quality of Life Outcomes, 11(1), 1-9.
, , & (2023). Psychological stress and psychological well-being among sports coaches: a meta-synthesis of the qualitative research evidence. International Review of Sport and Exercise Psychology, 16(1), 554-583.
(1979). Measurement theory. Addison-Wesley Publishing Company, Reading.
, , , & (2021). Predictors of well-being and productivity among software professionals during the COVID-19 pandemic: a longitudinal study. Empirical Software Engineering, 26(4), 62.
, , & (2020). The psychological and social impact of Covid-19: new perspectives of well-being. Frontiers in Psychology, 2550.
, , , & (2020). The impact of the COVID-19 pandemic on quality of life and well-being in Morocco. Archives of Community Medicine and Public Health, 6(2), 130-134.
, & (2019). El bienestar emocional como predictor de calidad de vida en los senior co-housing. Cuadernos de Trabajo Social, 2(32), 365-380.
, & (2003). Manual para profesionales de la educación, salud y servicios sociales. Madrid: Alianza editorial.
Sociological Research Center of Spain (2020). Effects and consequences of Coronavirus (I). https://www.cis.es/catalogo-estudios/fid/acceso-a-datos
(1946). On the theory of scales of measurement. Science, 103, 677-680.
(1951). Mathematics, measurement, and psychophysics. John Wiley & Sons.
, , , , , & (2009). Internal construct validity of the Warwick-Edinburgh mental well-being scale (WEMWBS): A Rasch analysis using data from the Scottish health education population survey. Health and Quality of Life Outcomes, 7(1), 1-8.
(2012). Regression for categorical data. Cambridge: University Press.
‚ & (1995). Development and psychometric validation of the Mental‚ Physical‚ and Spiritual Well-Being Scale. Psychological Reports‚ 77(2)‚ 659–674.
(2012). La medición del bienestar a través de indicadores subjetivos: una revisión. Santiago de Chile: Comisión Económica para América Latina y el Caribe (CEPAL).
, , , , & (2003). Health inequalities in the workforce: the labour market core-periphery structure. International Journal of Epidemiology, 32(6), 1015-1021.
, , , , , , & (2020). Immediate psychological responses and associated factors during the initial stage of the 2019 coronavirus disease (COVID-19) epidemic among the general population in China. International Journal of Environmental Research and Public Health, 17(5), 1729.
1 The methodology used by the Sociological Research Center of Spain is available in: https://www.cis.es/cis/opencms/EN/11_barometros/metodologia.html#ISE